Nearly 7 years ago, I started trading, and the core reason I’ve been able to “make the turn” and do this as a full-time job is that I was introduced to a strategy called Volume Profiling. Volume Profile Trading has helped me gain independence and stability, and I want to show you all you can achieve when you completely understand it.
Talking about it and explaining it is a huge topic, and it wouldn’t be fair to that concept to say that I will teach you everything there is to Volume Profile in just a single article or video. However, I will quickly give you many practical steps and actions that you can use immediately in your trading life.
How I Found Volume Profile?
If you are a trader that doesn’t have a system if you’re not consistent, and if you don’t have an approach on how you trade, then you don’t know what you are doing. You will be lost, and a lot of things are not going to make sense. Even if you see a YouTube video explaining a trading system and it works for them, don’t be fooled because that person might have handpicked the scenario where that trade makes sense and leave out the explanation.
What will happen next is that you might find yourself in a position to apply that strategy, but it’s not going to work how you thought. That’s because you need to understand the strategy first then use it in trading. You might be discouraged and, after some time, try another strategy. However, there were some instances where a trading strategy worked, and it got me some profits, but at the back of my head, I didn’t understand completely why it happened. Buying and selling when a line tells you without understanding its logic were not sustainable and wrong.
This was my journal until I found volume profile trading, and I’m sure many of you have gone a similar route. At least, I’m glad that your journey has led you here since I will explain everything you need to know before committing to a trading strategy. When I learned about Volume Profile, everything felt like it made sense, and something clicked inside my head.
What is the Volume Profile?
The Volume Profile is not like a magic bullet which once you find it, everything’s going to be perfect. You still have to understand it, build a skill level, and develop it. It’s not a straight path it has its ups and downs, but I pulled through and made it work really well, the secret is not to quit and not to get discouraged. My routine has been the same now and 2 years ago when I made it.
Volume Profile is simply displaying at every single price how much buying and selling occurred. It’s showing you the volume when we have a buyer and a seller that come together do business, when the buying and selling happen, we call that volume. That is important because if you understand the only reason that we have exchanges, the only reason that we have financial markets is that we are trying to match together buyers and sellers.
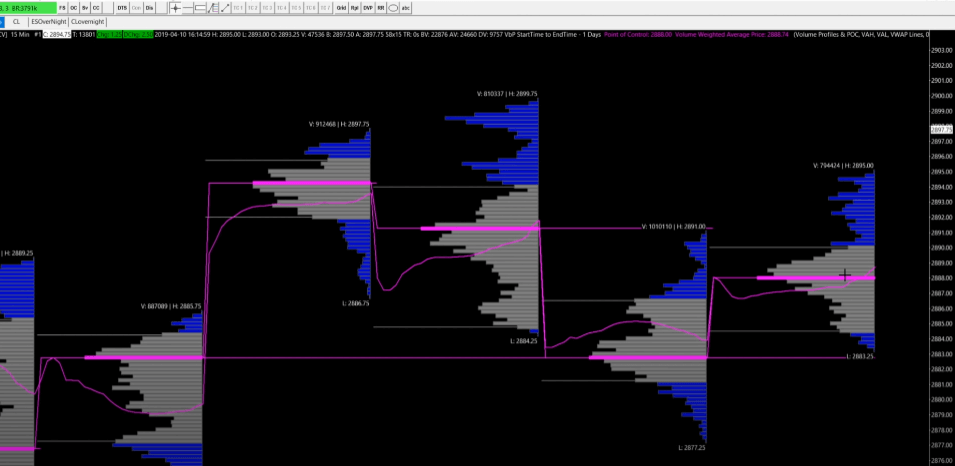
In its most simplistic sense, a volume profile is a histogram that’s been turned on its side, and it’s showing you at every single price where the buying and the selling are happening. This can be an intraday volume profile which can be really useful, or there’s another technique where you clump up some profiles together. If you want to use the same charts that I do, which are the Sierra Charts, then here’s the link where you can download it, and then it’s a simple matter of importing the file. The imported charts should look something like this in the picture down below.
Understanding the Volume Profile
Okay, first of you can see the top of the profile and the low, representing the high and the low of that price. On every volume profile, there are 2 colors, and as you can see on my configuration, we have the grey area and the blue area. What grey represents is that roughly 70% of all the trades are happening, and for the blue parts, there’s where the other 30% has taken place.
There’s a thick pink line present on all the profiles, as you can see from the picture above, and that’s the point of control or POC. What it tells us is which is the most popular price where the most buys and sells happen. As you may have noticed, there’s also a thin line going through all the profiles known as the V WHAP or Volume Weighted Average Price. This tells us the average price of the entire buying and selling at any given time or profile setting.
How to Use the Volume Profile for Mean Reversion Type Trading
Okay, so first of all, let’s look at the picture and try to understand what I explained before. I’m taking crude oil for this example, and I will explain everything step by step, so read carefully.
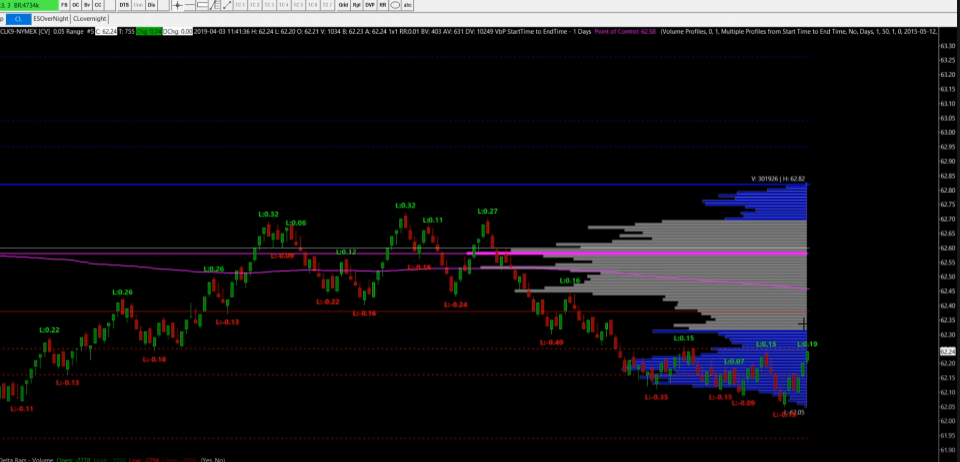
What we are trying to do here is to look to play the extremes of this profile back to the middle but back to the other end of the extreme, so we’re looking to play the value area. Let’s look back at the market’s opening, within the first minutes there, we can immediately spot an opening day high (O.R High) and an opening day low (O.R Low), and we can understand what type of day this is going to be. Illustrated by the picture below.
As you can see, we go on to violate the opening day high and low pretty quickly, so that means that we shouldn’t expect a trend today. And I shouldn’t even say that because there is no should or shouldn’t in the market since it will always do its thing but what I mean is that generally shouldn’t be a trend. What we can do to win here is to search for the mean reversion and play the extremes.
When to Act?
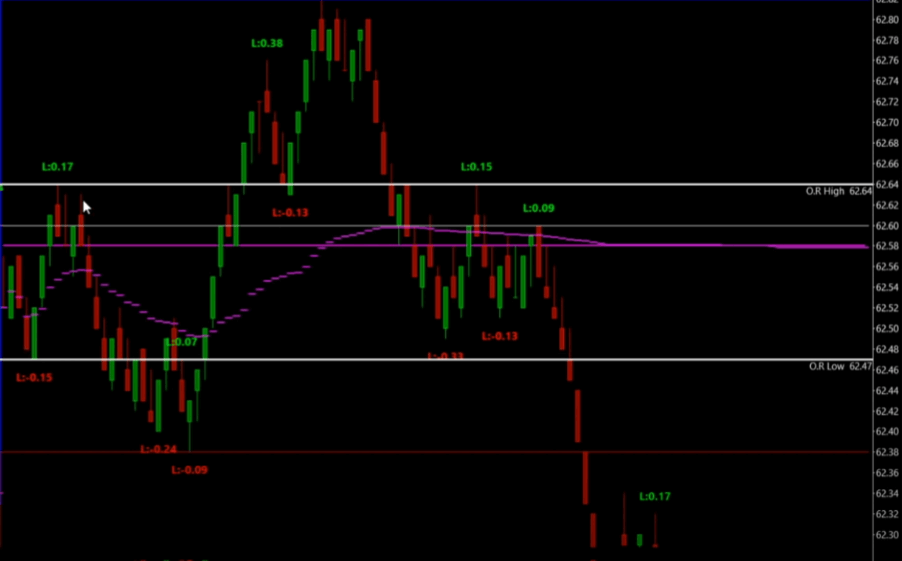
When there is a huge sell, and the price is on the extreme low, we need to wait until the price is on the value, which in this graph is represented by the grey area, and then go in. We then have to hold and wait for the price to go to the other side of the value block and then try to find the same thing all over again but in reverse. Let’s look at the picture below to understand it better.
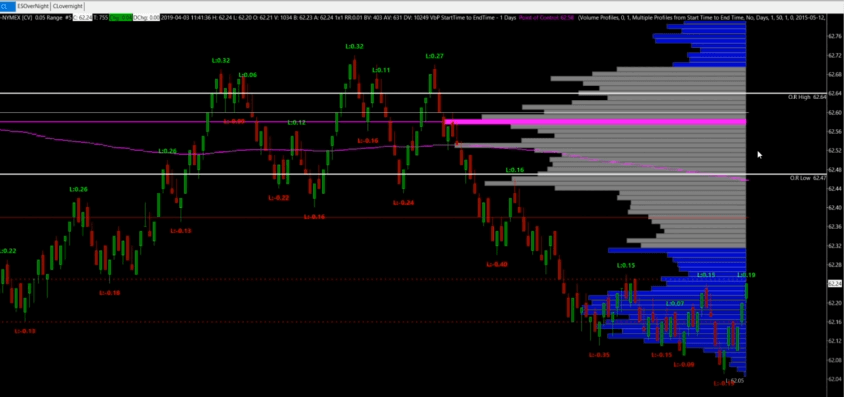
Okay, so what we need to do next is to wait for the price to come in the value zone and then purchase. You have to be patient with this step since it’s essential, and you have to buy at the first moment the price comes to the value zone, which for this example is somewhere near 62.33. Now let’s fast forward this day and look at the trading results later on the same day.
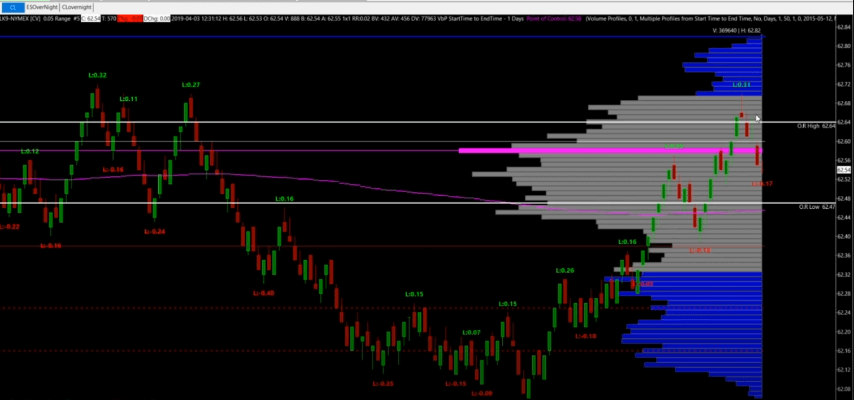
As predicted, the price did indeed go to the other side of the value block, and that’s where you should have sold and made a profit. Now you can flip the script if you want and do the same in reverse. This is a really great way to trade, and it can bring you a lot of profits but don’t run half-cocked with this information because it’s not as simple as buying the low of a volume profile and selling the high. The first hour of the day, for example, is bad for trading since the profile is still developing, and realistically you want to start trading where there has been developed so that you have more information.
Closing Thoughts
Like I said before, there are many things to consider and calculate before starting to trade. You need to know what kind of day it is by doing the opening range lines, if we are trending in a certain way, you can’t trade using the mean reversion strategy. This and many other factors will influence how you trade for a specific date, but the Volume Profile will help you drastically.
I have enrolled in many courses before, and some were only the topic of volume profile, and in the end, I managed to understand it well enough. This information is not available to many people for free, so I hope you have understood something here. If you want, you can enroll in a course with me for more advanced methods on trading with Volume Profile.
If you liked this article, check out our in-depth free training here.
Chartbook Definition For Sierra Charts
TradingView Tutorial for setting up the Volume Profile
Watch Your Risk & Happy Trading!
-Korbs
Volume Profile Frequently Asked Questions (FAQ)
What Does Volume Profile Tell You?
Volume Profile is a complex charting indicator and study that shows an asset’s trading volume over a specified period of time at certain price levels. It uses data from previous traded volumes, and all the strategies and plans come from historical data.
How Do You Read a Volume Profile?
Volume Profile takes the volume traded at a specific time for an asset at different price levels. It shows the total traded volume divided either via buy volume or sell volume, making it really easy for the trader to get that information.
How to Trade with Volume Profile?
Volume Profile it’s an important and handy tool for trading since it helps you figure out important price levels for an asset. It’s a common tool among traders and a verified strategy that works. Volume Profile helps you identify these high volume points in an asset, and the strategy is to wait for the price to drop below or break above these points.
Can You Day Trade With Volume Profile?
Volume Profile is useful for Day Trading if you already know how it works in the first place. Since it allows you to figure out price points with the volume data attached to it, you can form a strategy based on that and start day trading.